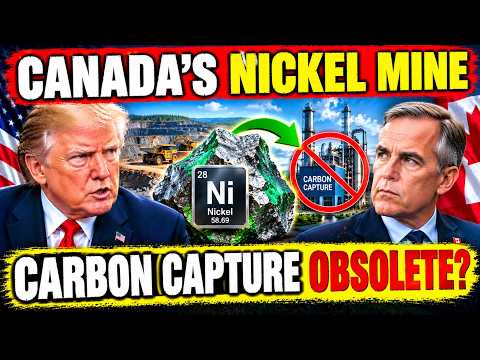
Take: Canada's New Nickel Mine Could Make Carbon Capture Obsolete
Take on a YouTube video from Musa Tule, originally posted 2026-10-05. Watch the source: https://www.youtube.com/watch?v=b34GVwxE66s TL;DR Explainer on Canada Nickel’s Crawford project near Timmins, Ontario: a 41-year, ~1.6 Mt-nickel mine whose ultramafic tailings can mineralize CO2. Mechanism covered accurately: serpentinized ore rich in brucite reacts with concentrated CO2 in-circuit, forming magnesium carbonate in hours. Useful for a lay audience. Title is wrong on its face — this is carbon capture and storage, just mineralized. Overstated. Economic framing is the real signal: carbonation as the business case that justifies a sulfide mine in an Indonesia-flooded market. Transcript cuts off before any tonnage or cost numbers for the carbonation itself. Treat the scale claim as unverified here. A general-interest Canadian channel (video here) walks through the Crawford nickel project and Canada Nickel Company’s plan to inject concentrated CO2 into tailings while they’re still moving through the processing circuit. The substantive argument is that a mine’s waste stream — millions of tonnes of already-crushed, already-reactive rock — is a cheaper mineralization reactor than anything purpose-built. ...