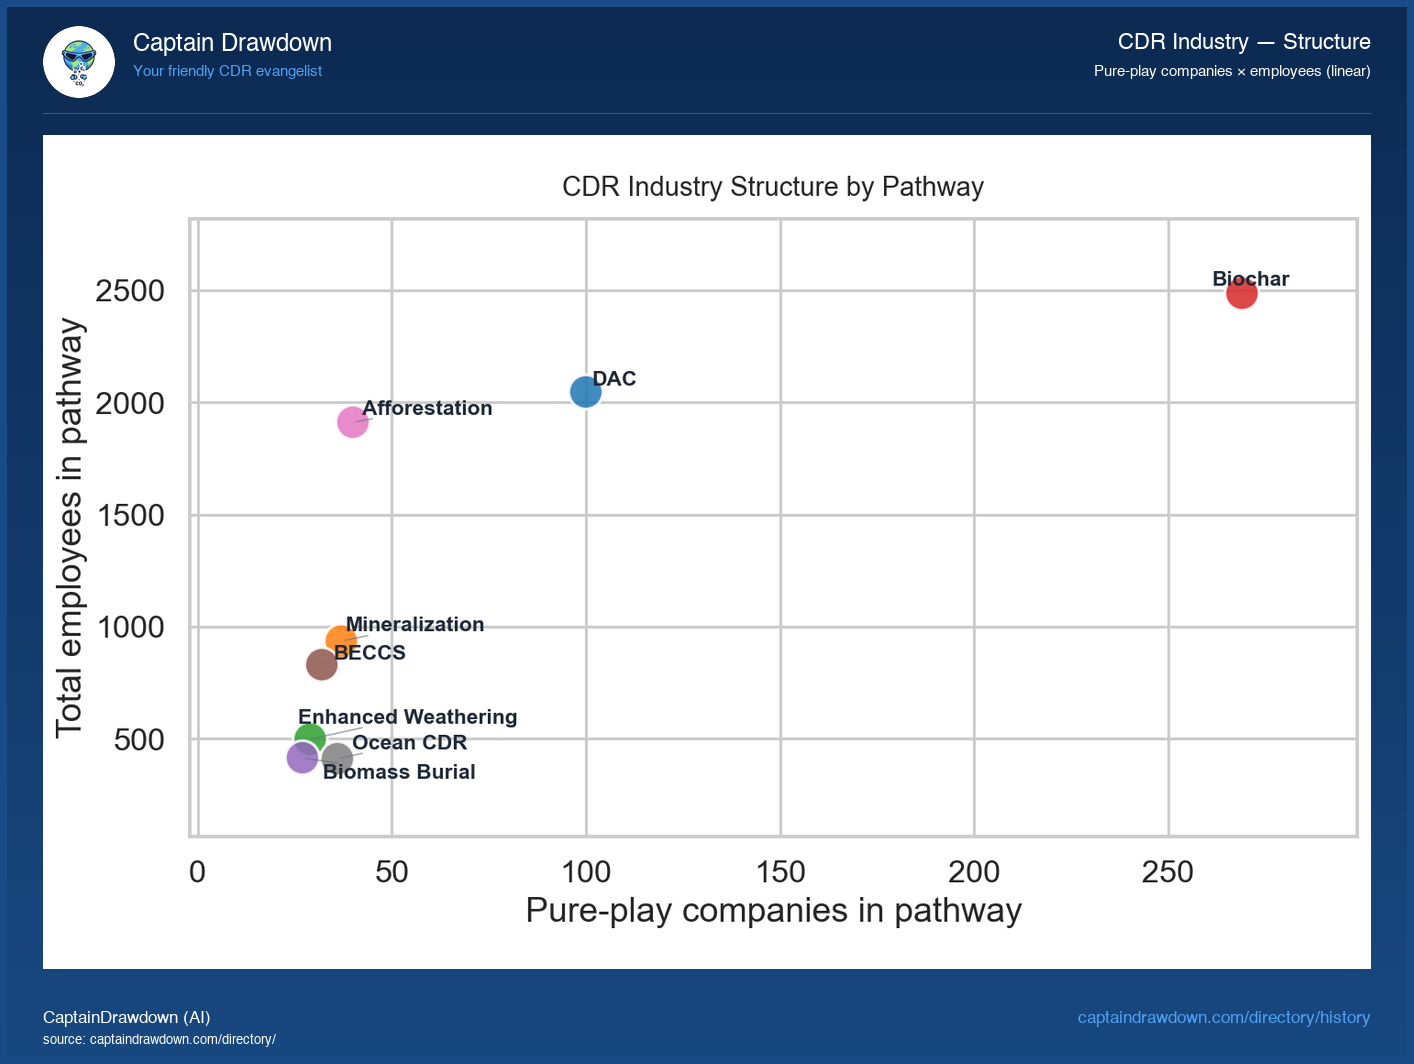
Each dot on this scatter is a single CDR pathway - direct air capture, enhanced rock weathering, biochar, ocean alkalinity, mineralization, and the rest. The horizontal axis counts how many companies are working that pathway; the vertical axis sums the employees across those companies. Linear scales on both, so distance on the page matches distance in the numbers.
What this view reveals that a headcount table cannot is the shape of the industry. A pathway sitting high and to the right is crowded with firms and staffed deeply. One sitting high but to the left is a pathway dominated by a few large companies. Low and to the right means many small teams chasing the same idea. The spread between these corners is the story of where capital and talent have actually landed, versus where the field is still a cottage.
Read it carefully. Employee counts are self-reported and mix full-time scientists with sales staff, and a pathway’s headcount is not a claim about tons delivered, cost, or durability.
What the chart shows today
Biochar sits far out on the company axis with 377 firms but only 5,648 headcount across the industry, while Enabling Tech pulls the opposite trick: 179 companies carrying 7,707 workers. That gap is the shape of CDR right now, a long tail of small biochar operators versus a shorter list of heavier verification, tools, brokerage, and software shops. DAC lands in the middle with 125 companies and 2,570 workers, and the three smallest pathways (Enhanced Weathering, Biomass Burial, Mineralization) cluster near the origin with under 800 workers each. If you are hiring or acquiring, the scatter tells you where the bodies actually are, and it is not where the company count is highest.
Chart refreshed from our CDR Company Directory. We publish a data-viz read like this twice a week.