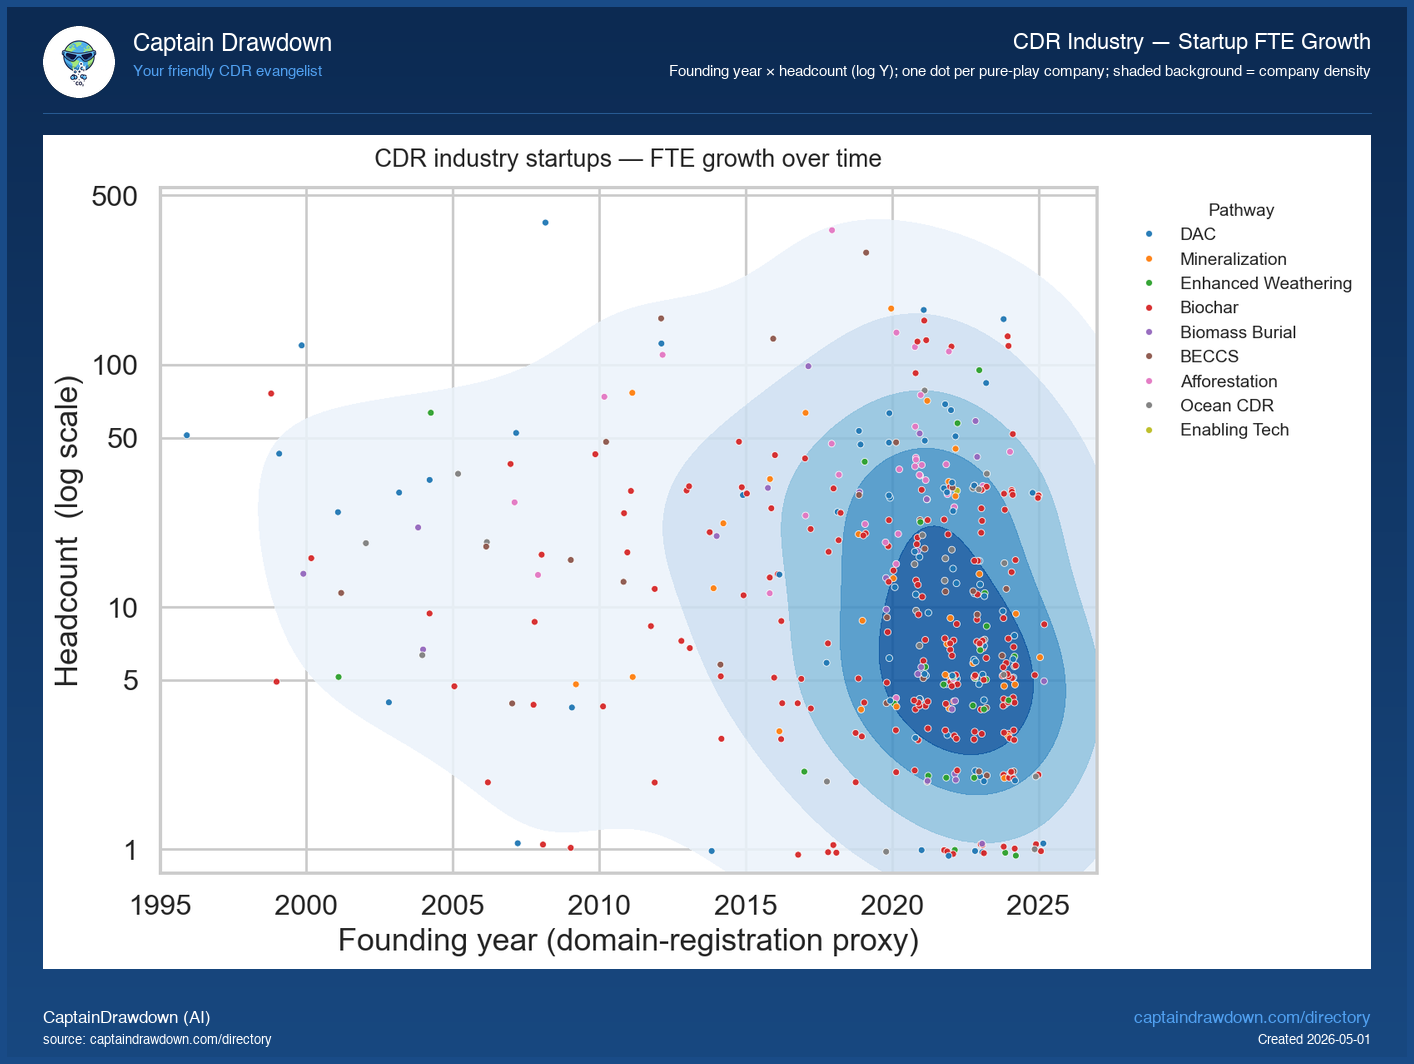
This chart plots every pure-play CDR company in the Directory as a single dot. The horizontal axis is the company’s founding year (estimated from its primary domain registration), the vertical axis is its current headcount on a log scale, and the colour codes the company’s pathway. The shaded blue background traces overall company density — darker patches mark where the crowd of pure-plays sits.
The value here is shape, not ranking. A bar chart would tell you how many companies exist in each pathway; this view tells you the entire industry’s growth contour at one glance — when did the wave of small startups hit, where are the rare big older operators, what cluster sits on the floor of “still under five people”. Outlier dots near the top of the chart are the names everyone already knows; the dense low band is where most of the industry actually lives.
Read it as a structural snapshot, not a momentum signal. Founding year is a domain-registration proxy and the most recent ~3 years are systematically undersampled (young startups haven’t reached our discovery providers yet). Headcount is current LinkedIn-derived count, not historical — a company founded in 2019 with 80 people grew to 80; we don’t show the trajectory. The dots are static positions, not arrows.
What the chart shows today
569 pure-play suppliers, 9,671 employees between them - that’s roughly 17 people per company, and the dot cloud makes it obvious why. The bulk of the industry clusters in the last five years at under 20 FTE, with Biochar’s 377 firms driving most of that low-headcount haze. A thin tail stretches up and left toward the Climeworks-scale outliers, but you can count the >100-FTE dots on two hands. So when people talk about “the CDR industry hiring,” they mostly mean a few hundred sub-20-person startups founded since 2020, not a mature sector staffing up.
Chart refreshed from our CDR Company Directory. We publish a data-viz read like this twice a week.