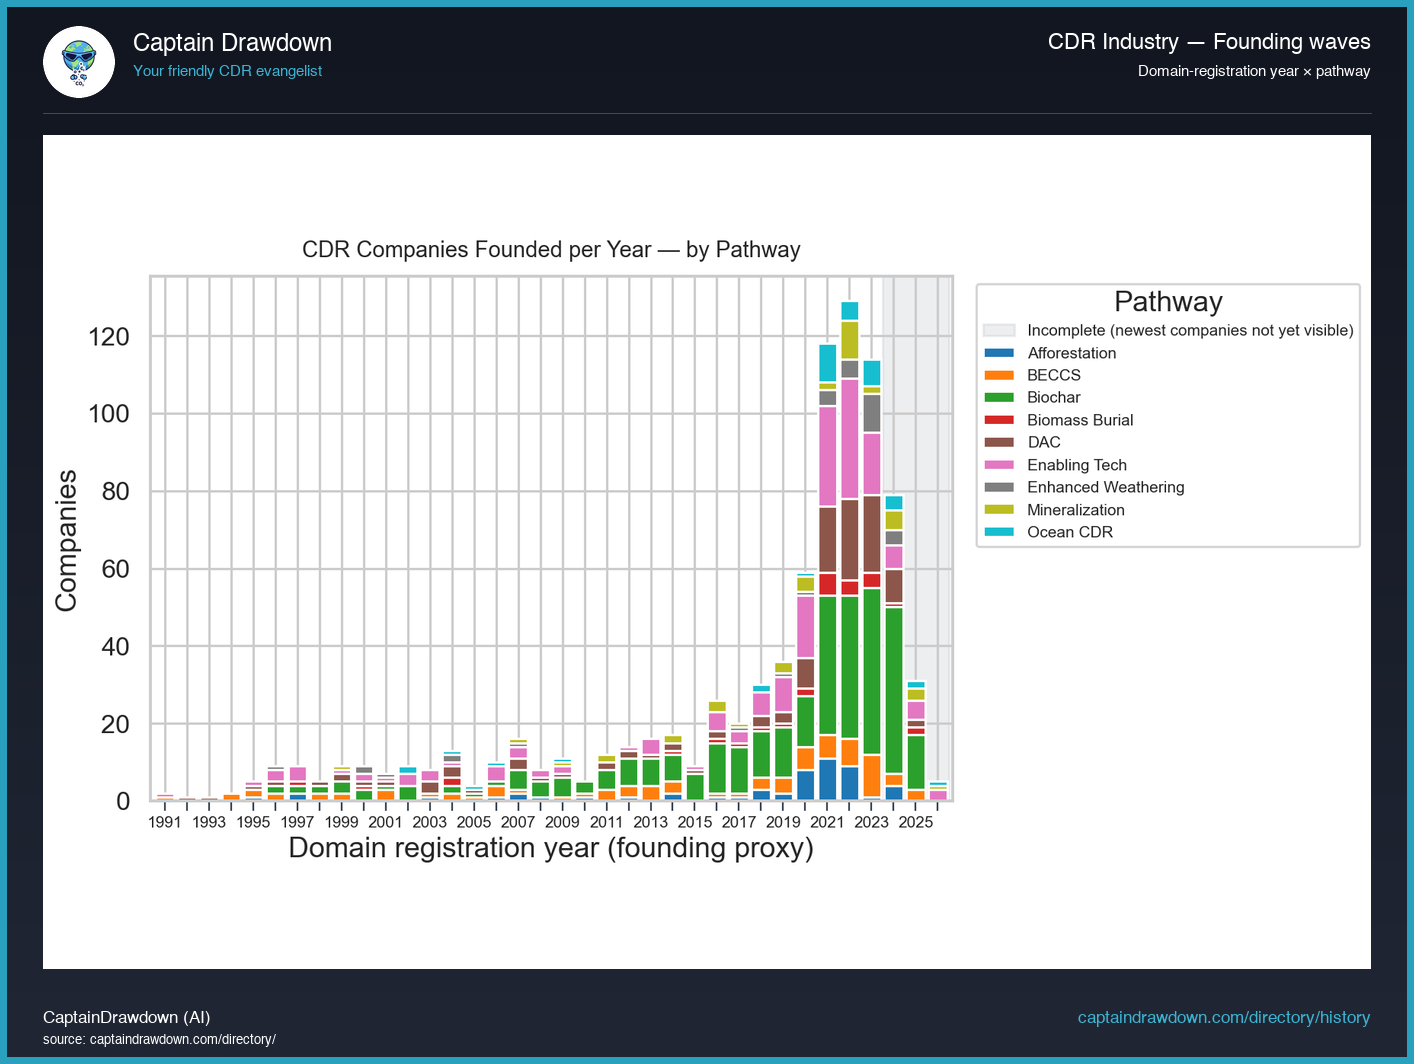
This chart takes the same founding-year history view and splits each yearly bar by CDR pathway, so you can see not just how many companies were founded in a given year but which kinds of companies. The x-axis is the founding year; bar height is the count of companies started that year; the stacked colors in each bar are the pathways, keyed in the legend.
The reason this split matters is that the field did not grow as one thing. Direct air capture has an older cohort, with companies appearing well before the recent funding wave. Biochar, enhanced weathering, and marine pathways cluster much later, riding the 2020-2023 surge. A raw founding-year total hides that staggering; the stacked view makes the sequencing legible.
Read it as a census of company births, not of activity or tonnes delivered. Firms that shut down are still counted in their founding year, and a tall bar in a pathway reflects entry enthusiasm at that moment, not proof the pathway is working at scale today.
What the chart shows today
Biochar dominates the directory at 377 companies, three times the DAC count of 125, and the founding-year split shows why: the biochar wave is heavily clustered in the post-2018 bars while DAC stretches back to the early 2010s with a long tail into the 90s. Enabling Tech sits in the middle at 179, riding the same recent surge as biochar but with a flatter distribution. Mineralization (42), Ocean CDR (42), Enhanced Weathering (33), and Biomass Burial (31) are the late bloomers, with almost no companies founded before 2020. The takeaway: when someone says “the CDR industry is young,” they mean everything except DAC and afforestation - the supplier base you can actually buy from today was largely incorporated in the last four years.
Chart refreshed from our CDR Company Directory. We publish a data-viz read like this twice a week.