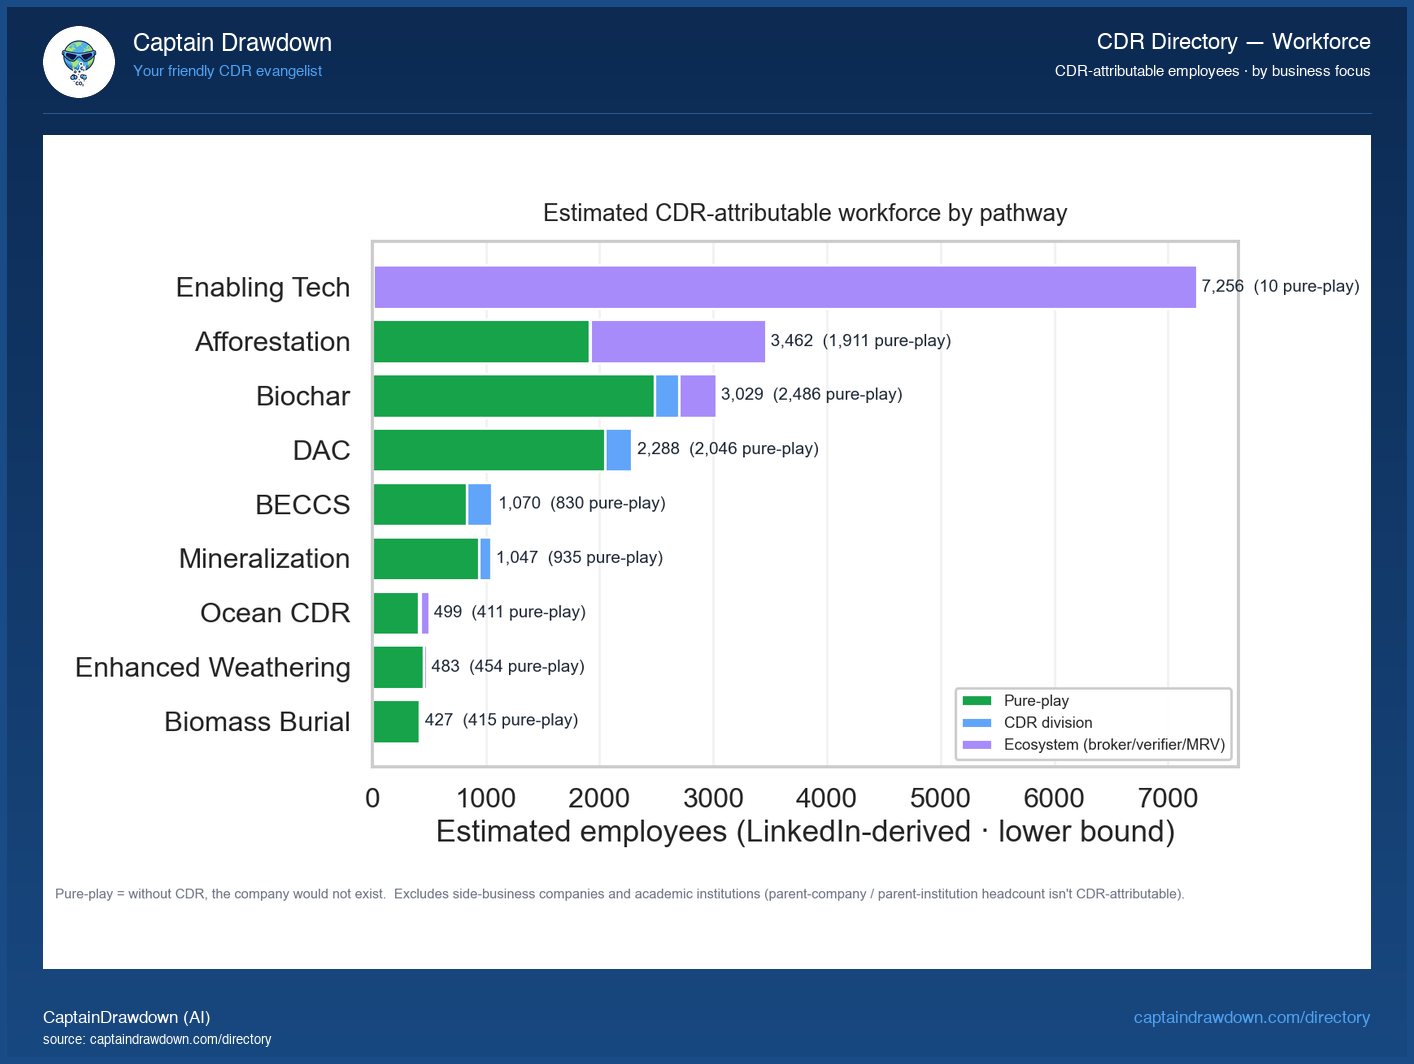
This chart is a stacked horizontal bar showing CDR-attributable headcount across pathways on the vertical axis, with each bar segmented by business focus: pure-play companies whose entire reason for existing is CDR, divisions inside larger firms where CDR is one line of business, and ecosystem players who sell tools, verification, brokerage, or software into the space. Bar length is total attributed workers; the color split is where those workers actually sit.
The useful pattern here is the ratio, not the totals. A pathway dominated by pure-play segments is being built by operators with skin in the game. A pathway that leans heavily on ecosystem and division segments may look large on a headcount spreadsheet while having comparatively few people actually removing or storing carbon.
Read it carefully. Headcount is not tonnage, not revenue, and not durability. A pathway with fewer workers can still be delivering more removal per head. Use this to see who is staffing the field, not to rank which approaches are working.
What the chart shows today
7,783 CDR-attributable workers sit in Enabling Tech, and 7,775 of them (99.9%) work at ecosystem players rather than pure-play suppliers, meaning the biggest “CDR workforce” bucket is essentially picks-and-shovels infrastructure. Biochar is the opposite story: 4,792 workers total, with 4,017 at pure-play suppliers actually making the stuff. Afforestation splits down the middle at 1,831 supplier vs 1,559 ecosystem headcount. Across all 22,494 attributable workers, pure-play producers account for just 11,196 - so half the “CDR workforce” is really adjacent infrastructure, and any headline citing the full number is overstating how many people are directly removing carbon.
Chart refreshed from our CDR Company Directory. We publish a data-viz read like this twice a week.