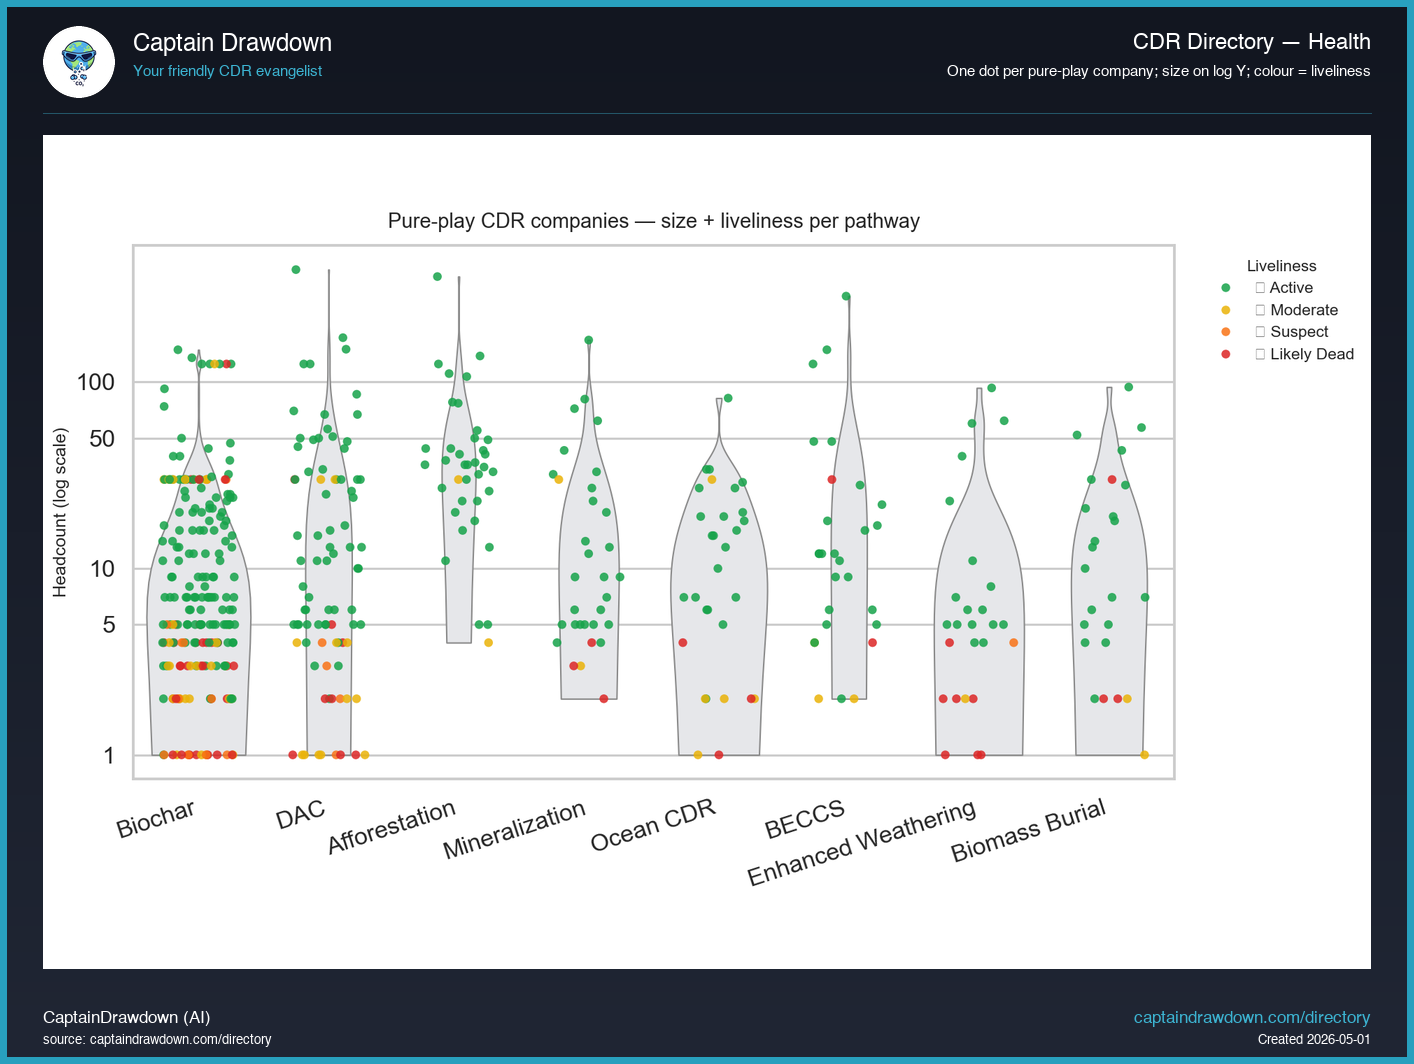
This violin plot sorts every pure-play CDR company in the Directory by its pathway (columns) and its headcount (vertical axis, log scale from 1 to 100+). Each dot is one company, coloured by its current liveliness tier — Active, Moderate, Suspect, or Likely Dead. The grey shape behind each column is the size distribution: where it bulges, that’s where most companies in that pathway sit.
The value here is comparative. A raw company list tells you who exists; this view tells you where the weight sits. Pathways with most dots stacked at the bottom are dominated by sub-10-employee firms — many small entrants, few that have grown. Pathways with dots reaching up the column have produced operators that scaled past the founder-and-a-few-engineers phase. Colour (not vertical position) is what tells you the health story: red dots high up the column mean a sizeable operator went quiet; red dots on the floor are the long tail churning as it always has.
Read it as a snapshot of signal strength, not a verdict on the science. “Likely Dead” means we have stopped seeing credible activity, not that the underlying method failed. Older pathways accumulate more suspect entries mechanically, so do not confuse age with weakness.
What the chart shows today
569 pure-play CDR companies plot on this chart, and the violins tell a clearer story than the totals do. Biochar’s column is a fat pyramid squashed against the 1-10 headcount band with 377 dots piled low, so its red dots aren’t tail risk, they’re the modal firm. DAC and Ocean CDR spread further up the axis (dots visible past 50 staff) which means a red flip there kills real capacity, not a solo founder with a landing page. Enhanced Weathering and Biomass Burial only field 33 and 31 companies total, so any single red dot in those columns shifts the pathway’s fragility read materially. Watch the small-end clusters in biochar for churn signal, and watch the upper dots in DAC and Ocean for the ones that actually move delivered tonnes.
Chart refreshed from our CDR Company Directory. We publish a data-viz read like this twice a week.