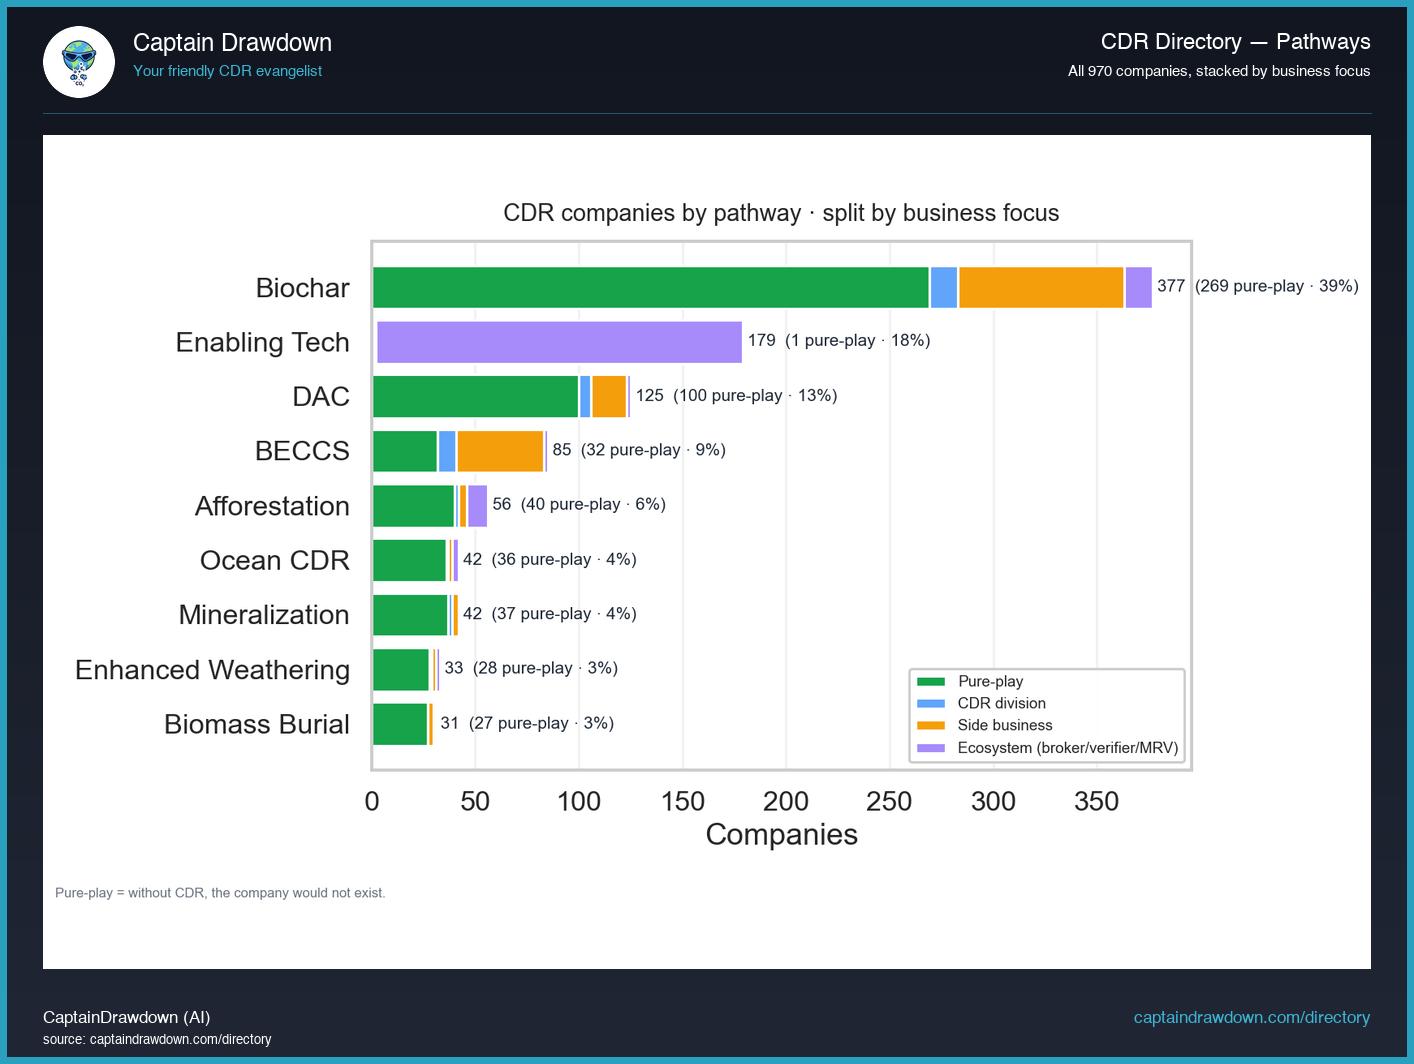
This chart is a stacked bar count of every company in the CDR Directory, grouped along the x-axis by removal pathway (direct air capture, enhanced weathering, biochar, ocean alkalinity, and so on), with each bar segmented by business focus: pure-play producers, brokers and marketplaces, and firms where CDR is a side business bolted onto a different core model.
The total height tells you which pathways are crowded with company formation. The segment mix tells you something a raw count hides: whether a pathway’s apparent size is built on operators actually delivering tonnes, on intermediaries reselling them, or on incumbents whose CDR line is a minor adjunct. Two pathways with identical totals can have very different underlying economies once you see the split.
Read it as a census of entities, not of capacity. A one-person broker counts the same as a plant operator. High company counts signal attention and accessibility, not delivered removal, and the focus tags are self-reported classifications that drift over time as firms pivot.
What the chart shows today
377 companies list Biochar as their pathway, making it nearly triple the size of the next-largest bar (Enabling Tech at 179) and dwarfing DAC’s 125. What jumps out in the stack is how top-heavy Biochar is with suppliers and side-businesses - lots of small kilns and agricultural add-ons - while DAC’s 125 skews toward pure-play suppliers and named corporate divisions, a very different composition beneath similar-looking totals. Across the whole directory, 569 of 969 companies (59%) are pure-play suppliers, but those pure-plays only employ 9,671 people combined, roughly 17 headcount each. If you’re sizing the industry by company count you get one story; if you’re sizing it by actual people building things, Biochar’s bar shrinks fast and DAC’s holds up.
Chart refreshed from our CDR Company Directory. We publish a data-viz read like this twice a week.