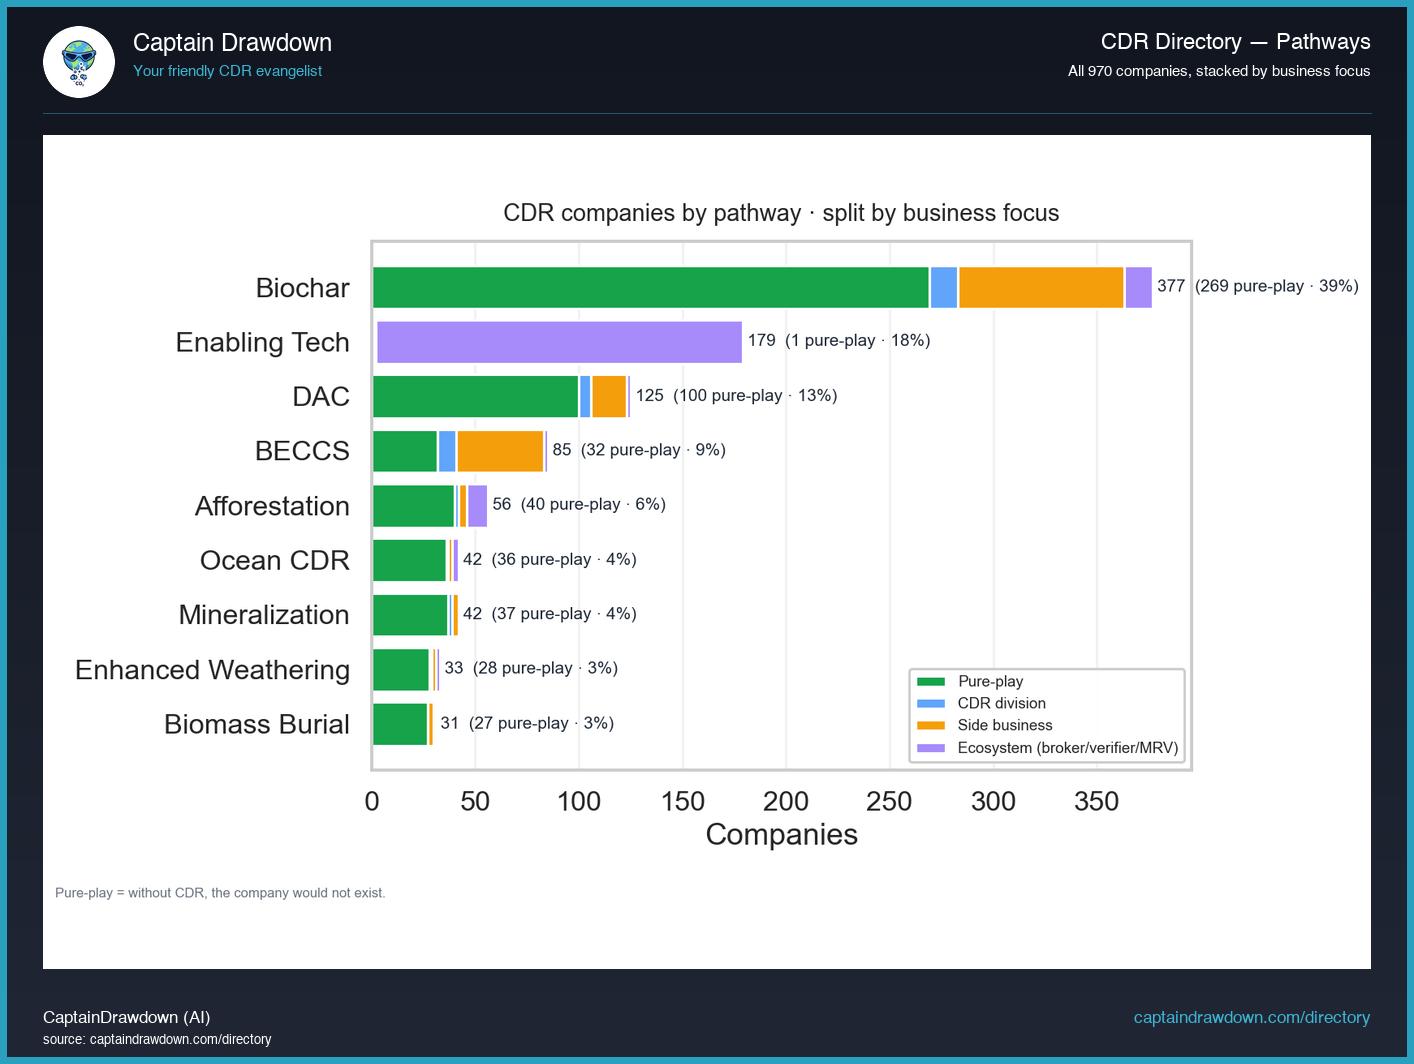
This chart is a stacked bar count of every company in the CDR Directory, grouped along the x-axis by removal pathway (direct air capture, enhanced weathering, biochar, ocean alkalinity, and so on), with each bar segmented by business focus: pure-play producers, brokers and marketplaces, and firms where CDR is a side business bolted onto a different core model.
The total height tells you which pathways are crowded with company formation. The segment mix tells you something a raw count hides: whether a pathway’s apparent size is built on operators actually delivering tonnes, on intermediaries reselling them, or on incumbents whose CDR line is a minor adjunct. Two pathways with identical totals can have very different underlying economies once you see the split.
Read it as a census of entities, not of capacity. A one-person broker counts the same as a plant operator. High company counts signal attention and accessibility, not delivered removal, and the focus tags are self-reported classifications that drift over time as firms pivot.
What the chart shows today
Biochar dominates the directory with 377 companies, more than triple any other pathway and roughly 39% of the 969 visible today. The next tier drops sharply: Enabling Tech at 179, DAC at 125, BECCS at 84, then Afforestation at 56, with Mineralization and Ocean CDR tied at 42, Enhanced Weathering at 33, and Biomass Burial trailing at 31. Suppliers (the pure-play producers and service shops) make up 569 of the total, but those 569 companies collectively employ just 9,499 people - an average of 17 heads each, which tells you how much of this “industry” is still a handful of folks in a shed. The composition story to watch is biochar’s stack: if side-business and ecosystem players keep crowding in around a thin layer of true producers, the pathway count overstates how much actual tonnage capacity exists.
Chart refreshed from our CDR Company Directory. We publish a data-viz read like this twice a week.