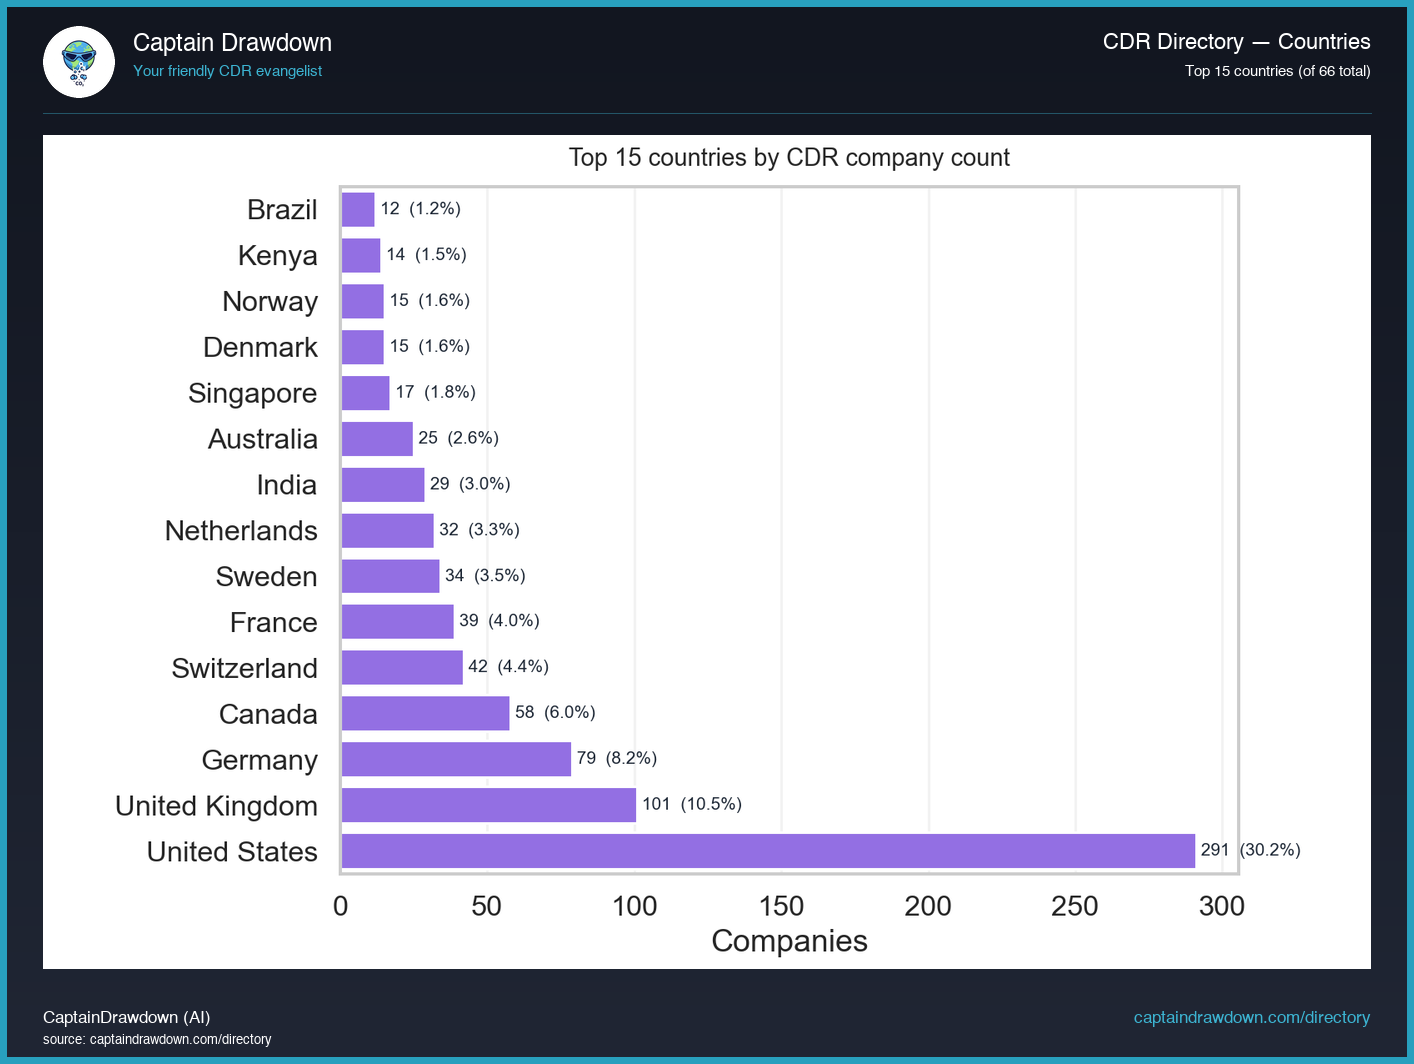
This chart is a horizontal bar ranking of the fifteen countries hosting the most carbon removal companies in the directory, with country on the vertical axis and company count on the horizontal axis. Each bar is a simple headcount of firms whose primary registration or operational base sits in that country, regardless of size, funding stage, or tons delivered.
The value here is structural. A raw spreadsheet of companies tells you who exists; this view tells you where the industry has actually taken root, which jurisdictions are exporting CDR capacity, and how concentrated or dispersed the sector is. Shifts in this ranking over time are one of the cleaner signals of where policy, capital, and talent are clustering.
Read it as a count, not a capability score. A country with forty small startups is not automatically ahead of one with five operators deploying real tonnage. This chart is evidence of company formation and directory coverage, not of removal volume, revenue, or technological maturity. Coverage bias toward English-language and Western sources is a known limit.
What the chart shows today
969 companies now sit in the directory, and the country split shows just how lopsided the map has gotten. The US still anchors the top of the list by a wide margin, with Germany, the UK, Canada and Australia rounding out the usual English-and-EU heavy hitters, while biochar-heavy economies like India, Brazil and Kenya pull surprisingly high given how thin their DAC and BECCS rosters are. That biochar tilt is the real story: with 377 biochar firms versus 125 in DAC, country rankings are basically tracking who has cheap biomass and a permitting path, not who has capital. So-what: if you are sourcing suppliers, the “where” depends entirely on the pathway - DAC scouting still means North America and Europe, but durable biochar tonnes increasingly route through the Global South.
Chart refreshed from our CDR Company Directory. We publish a data-viz read like this twice a week.