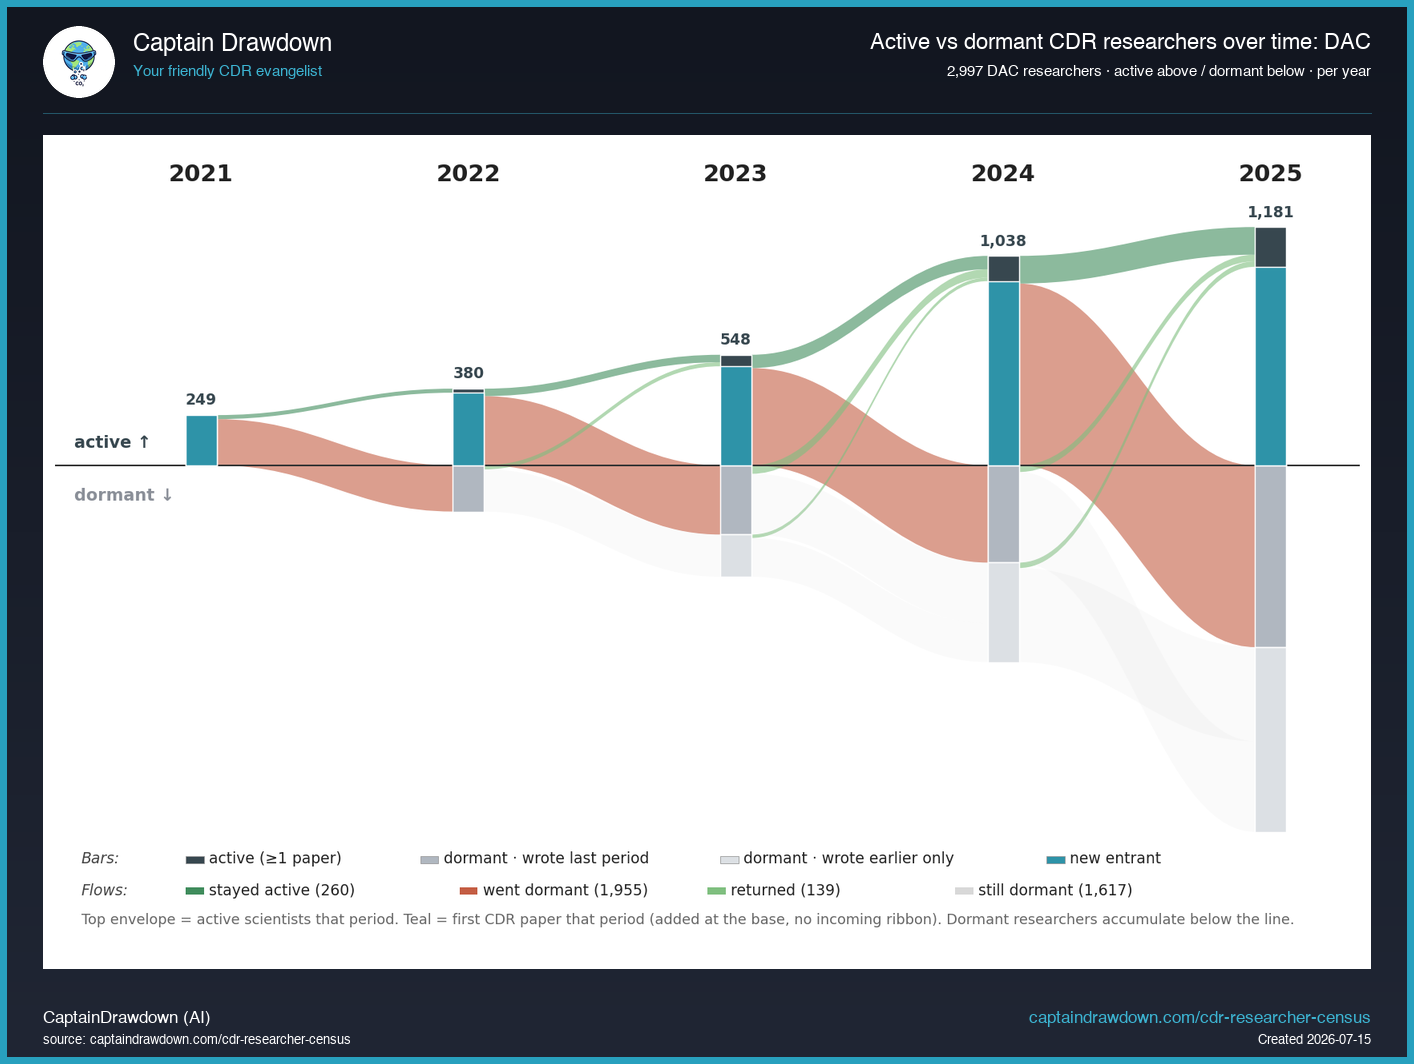
This chart tracks DAC researchers over time on a diverging axis. Above the line are researchers who published a DAC-relevant paper that year (active); below the line are dormant researchers, split into those who published the previous year and those who published only earlier. New entrants join at the base of the active band each year as a teal block. DAC is direct air capture, the most capital- and headline-heavy pathway. The top envelope is the number actually publishing in the pathway each year.
The useful pattern is how the active band and the dormant floor compare. DAC currently stands at 1,184 active in 2025 — only 29% of members, the lowest retention of any pathway. Younger pathways show a steep active band over a shallow dormant floor — the people who arrived are still there — while older or broader ones carry a much deeper dormant pool of past one-time contributors. Watching the top envelope over the years shows whether the pathway is still recruiting and keeping researchers.
Read the active envelope, not the total height. At yearly resolution a skipped publication year reads as “dormant” and a later paper as a return, so the dormant bands overstate permanent exits. The working figure for DAC is the top line each year, and its slope over 2021–2025 is the real signal.
What the chart shows today
1,184 active DAC researchers in 2025, just 29% of everyone who ever published in the pathway - the worst retention rate on the board. That churn shows up in the company census too: only 125 DAC firms are currently visible in the directory, employing 2,652 people across suppliers (2,409), divisions of larger parents (241), and a rounding-error 2 in “ecosystem” roles (verification, tools, brokerage). The pattern is a long tail of one-paper visitors who tried DAC once and moved on, leaving a smaller core of committed suppliers to carry the pathway. If you are hiring or funding in DAC, assume the talent pool is shallower than the historical author count suggests and price accordingly.
Chart refreshed from our CDR Company Directory. We publish a data-viz read like this twice a week.