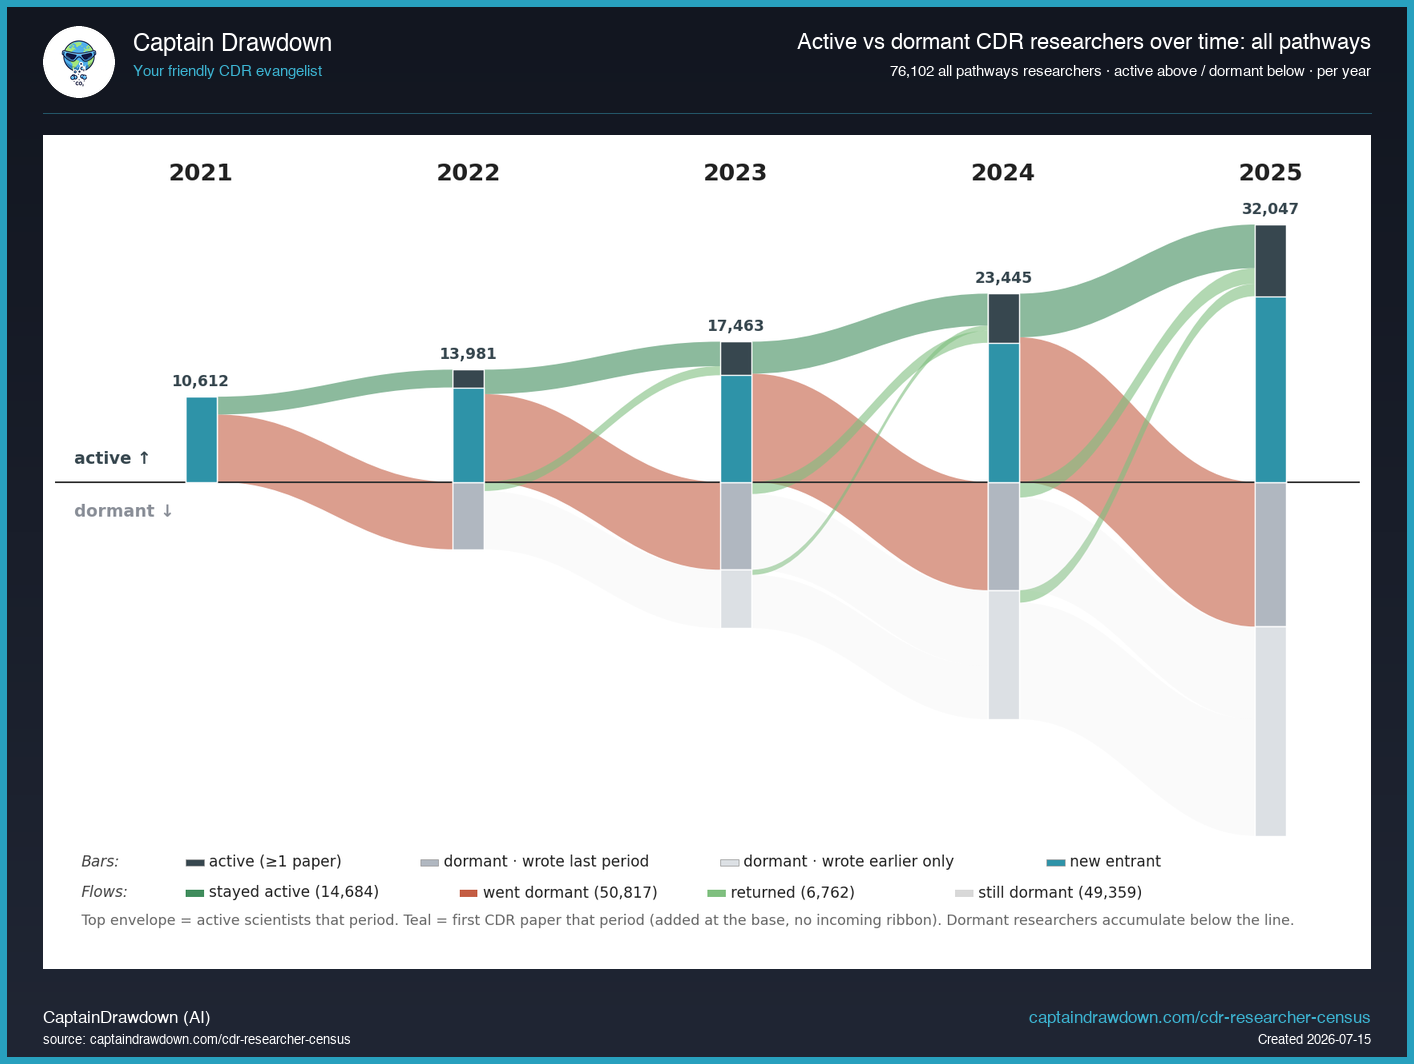
This chart tracks CDR researchers over time on a diverging axis. Above the line are researchers who published a CDR-relevant paper that year (active), stacked upward; below the line are dormant researchers, split into those who published the previous year and those who published only earlier. New entrants join at the base of the active band each year as a teal block. The top envelope is the real, working research workforce each year — the number of people actually publishing, not the cumulative head-count.
The useful pattern is the gap between the two. The active envelope grows steadily — the field genuinely recruits — but the dormant pool below grows faster, because carbon-removal research has a large one-paper-and-gone population. A cumulative census counts everyone who ever published; this chart separates the people still working from the people who passed through once.
Read the active envelope, not the total height. Yearly resolution means a researcher who simply skips a publication year shows as “dormant” and returns later, so the dormant bands overstate permanent exits. The honest headline is the top line: how many researchers are actively publishing on CDR right now, and how fast that number is climbing.
What the chart shows today
32,000 active CDR researchers now sit above the line in 2025, up from 10,600 in 2021, but the dormant pool below has ballooned even faster as one-paper authors pile up year after year. The teal new-entrant block at the base is still thick in 2024-2025, meaning the field keeps recruiting rather than retaining. That gap between the working roster and the cumulative pile is the real story: most people who touch CDR research leave within a year, and the “field” you read about in headlines is a much smaller working core than citation counts suggest. For context on the commercial side, our supplier directory tracks 569 pure-play companies employing just 9,671 people - the labor market is thin on both sides of the academy-industry line.
Chart refreshed from our CDR Company Directory. We publish a data-viz read like this twice a week.