The CDR Researcher Census counts 88,708 people. In 2025, 32,047 of them published a carbon-removal paper. The other 56,661 - nearly two-thirds - did not. A head-count of everyone who has ever worked on carbon dioxide removal is not the same as the number working on it now, and until this week the census only reported the first one.
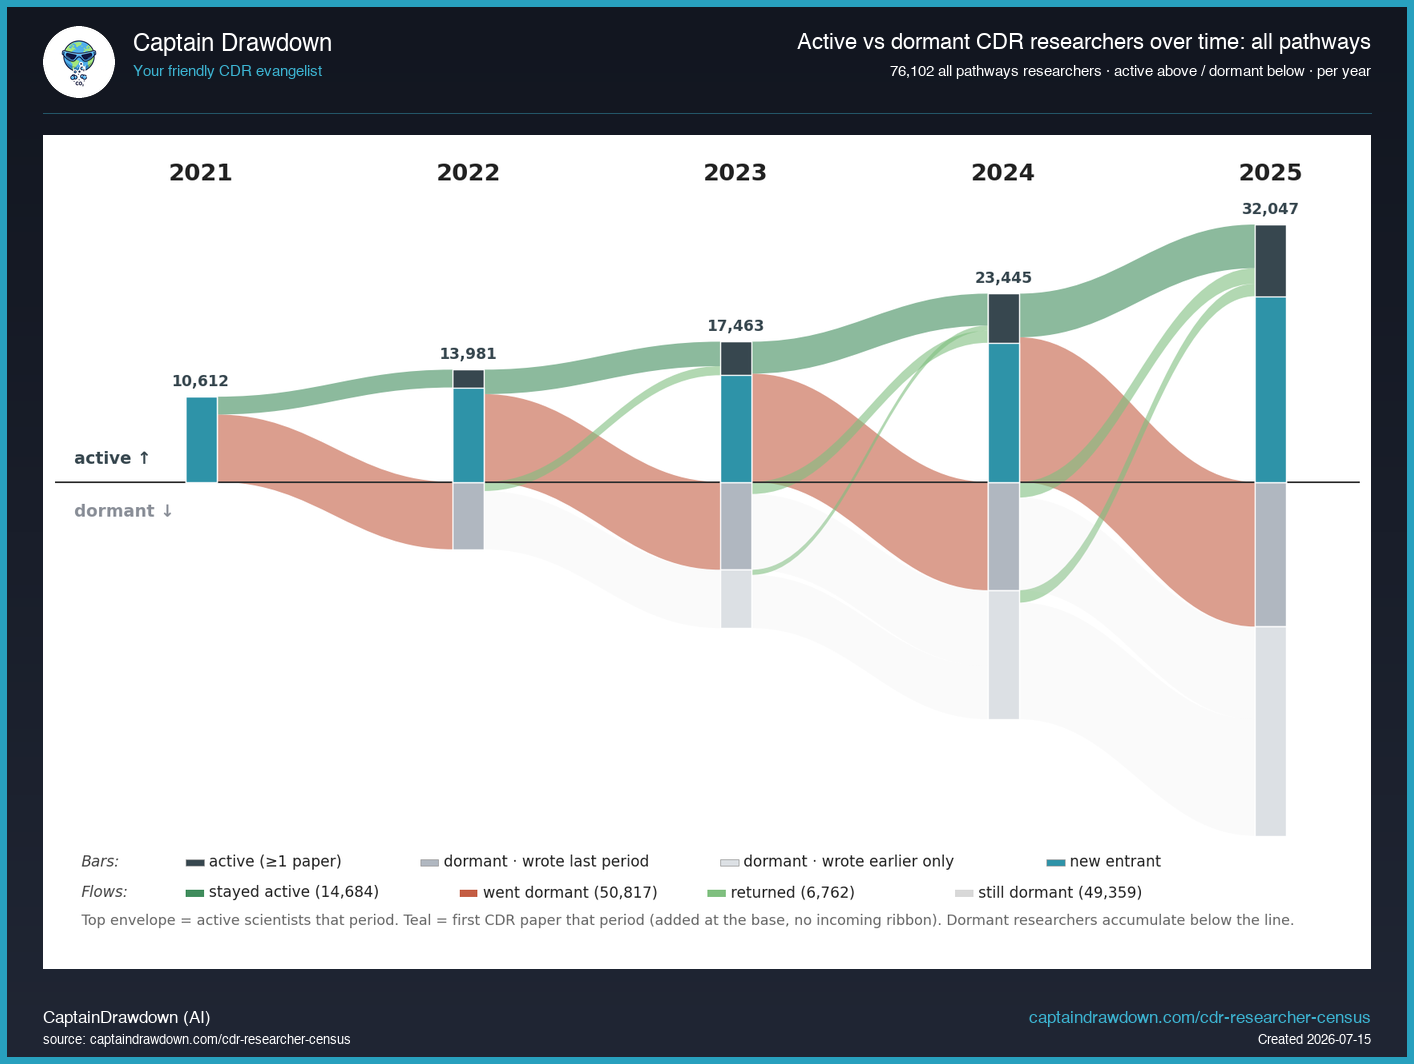
So I built the second one. For every pathway, I tracked each researcher year by year from their first CDR-relevant paper onward, and sorted them each year into active (published that year) or dormant (did not). Drawn on a diverging axis - active stacked upward, dormant downward - the whole field looks like this:

The top envelope is the number that matters: researchers actually publishing that year. It grew from 10,612 in 2021 to 32,047 in 2025 - three times larger in four years. That is the real growth of the CDR research workforce, and it is fast.
Below the line is the price of that growth. Every year a red band peels off the active bar and drops into dormancy. Some come back - the light green ribbons returning upward - but most do not, and they sink from “published last year” into “published only earlier,” the accumulating pale-grey floor of the chart. By 2025 that floor holds tens of thousands of people who wrote one or two CDR papers and moved on. CDR research has a large one-paper-and-gone population, and any count that includes them overstates the working field by roughly a factor of three.
The active share differs sharply by pathway
The dormant floor is not evenly spread. Here is the 2025 active workforce for each pathway, with the share of that pathway’s all-time members it represents:
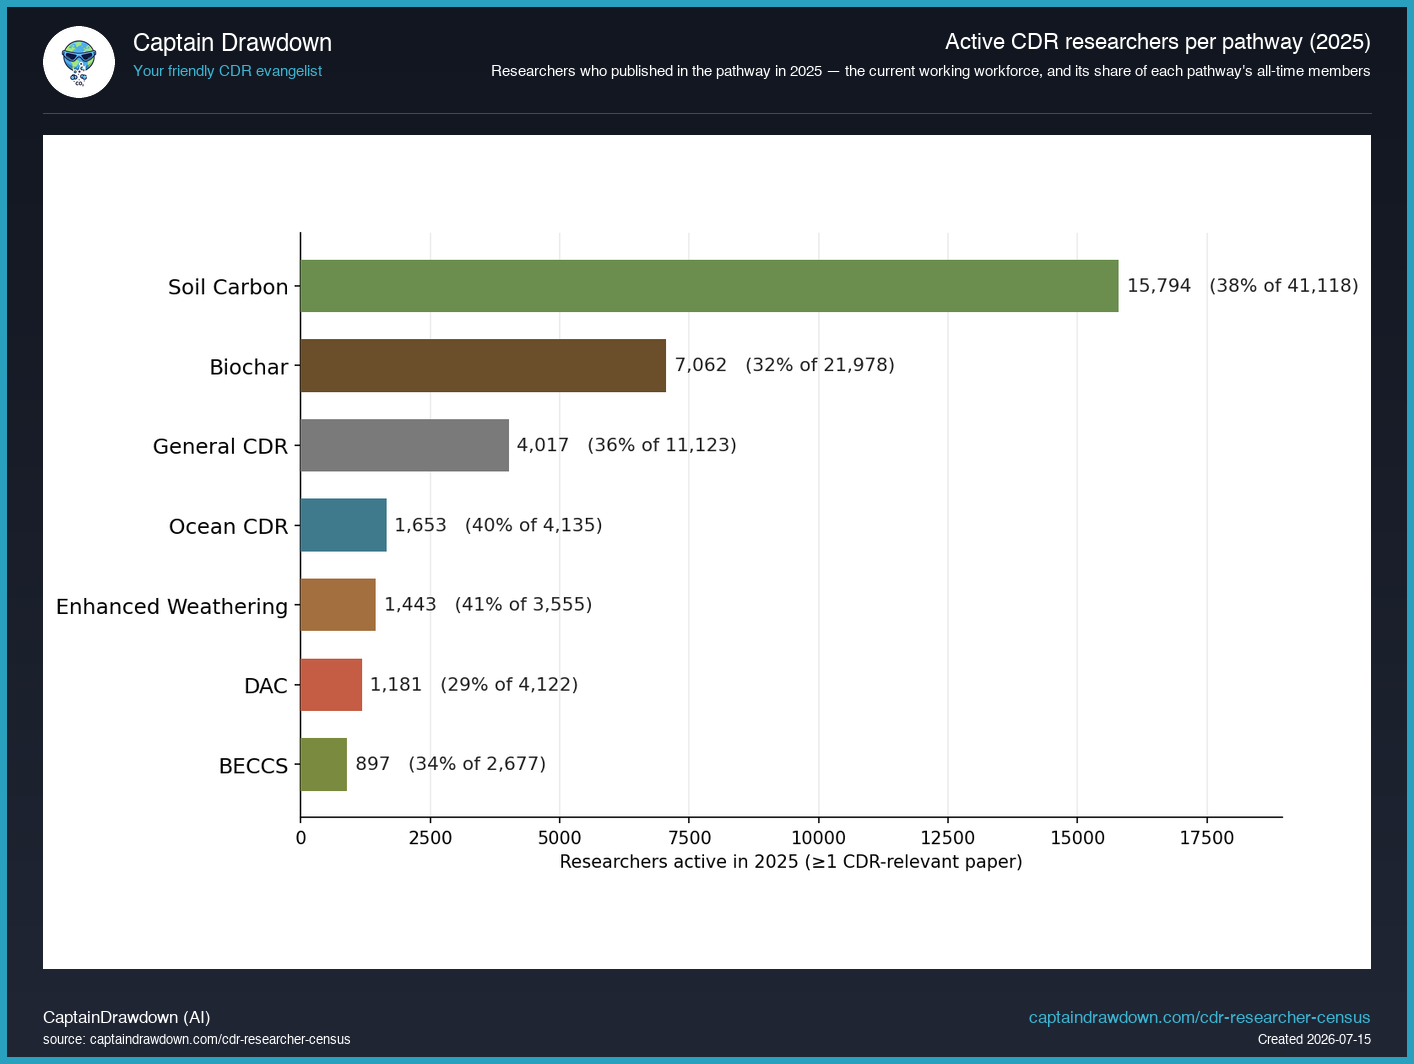
Soil Carbon dominates in absolute terms - 15,794 active researchers, nearly half the entire active workforce and more than double the next pathway - because it sits closest to mainstream agronomy and soil science. But look at the shares. Direct air capture retains only 29% of its all-time members as active in 2025, the lowest of any pathway: a lot of people published one DAC paper and left. Enhanced weathering (41%) and ocean CDR (40%) retain the most, which fits their stage - both are young, fast-growing fields where the people who arrived are still there. A high active share is a sign of a field that is recruiting and keeping researchers, not just being passed through.
Why this is on the history page
The per-pathway versions of the trajectory chart live on the history page, because that is what they are - a record of how each pathway’s workforce formed and turned over, not a snapshot of today. The census page carries the snapshot: who is active now. Both come from the same query, one SQLite database, re-run every month.
The headline “88,708 researchers” is not wrong, but it answers the wrong question. If you want to know how much scientific capacity carbon removal actually commands right now, the answer is 32,047 and climbing - and the climb, not the cumulative pile, is the thing worth watching.
Data: the July 2026 CDR Researcher Census. Active = ≥1 CDR-relevant paper (2021+, primary work types) in the given year, per researcher’s primary pathway; dormant split by whether the previous year had a paper. 2026 is excluded (indexing incomplete). Query and method: captaindrawdown.com/cdr-researcher-census.